What is Affinity Diagram?
Affinity diagram, also known as Kawakita Jiro or KJ Method, is a chart that organizes ideas, problems, and possible solutions, emerged after a brainstorm, into natural categories. In this way, it transforms large bulks of fragmented information into cohesive groups based on their affinity, or similarity. For example, it is not uncommon for an affinity diagram to have 40, 60, or even 200 items that are reduced to up to ten groups.
This method, created in the 1960s by Japanese anthropologist Jiro Kawakita, relies on the team’s creativity and intuition to get a better insight into problems.

When it is used
Affinity diagram is used to consolidate information related to a product, process, or a specific problem when there are too many seemingly unrelated facts, or the issue is too complex to grasp, or simply when the decision should be made by the whole group.
The most typical use cases are:
- Following up on brainstorming output
- Organizing large data sets
- Establishing relationships between ideas
- Analyzing verbal data, such as polls or surveys
How it's done
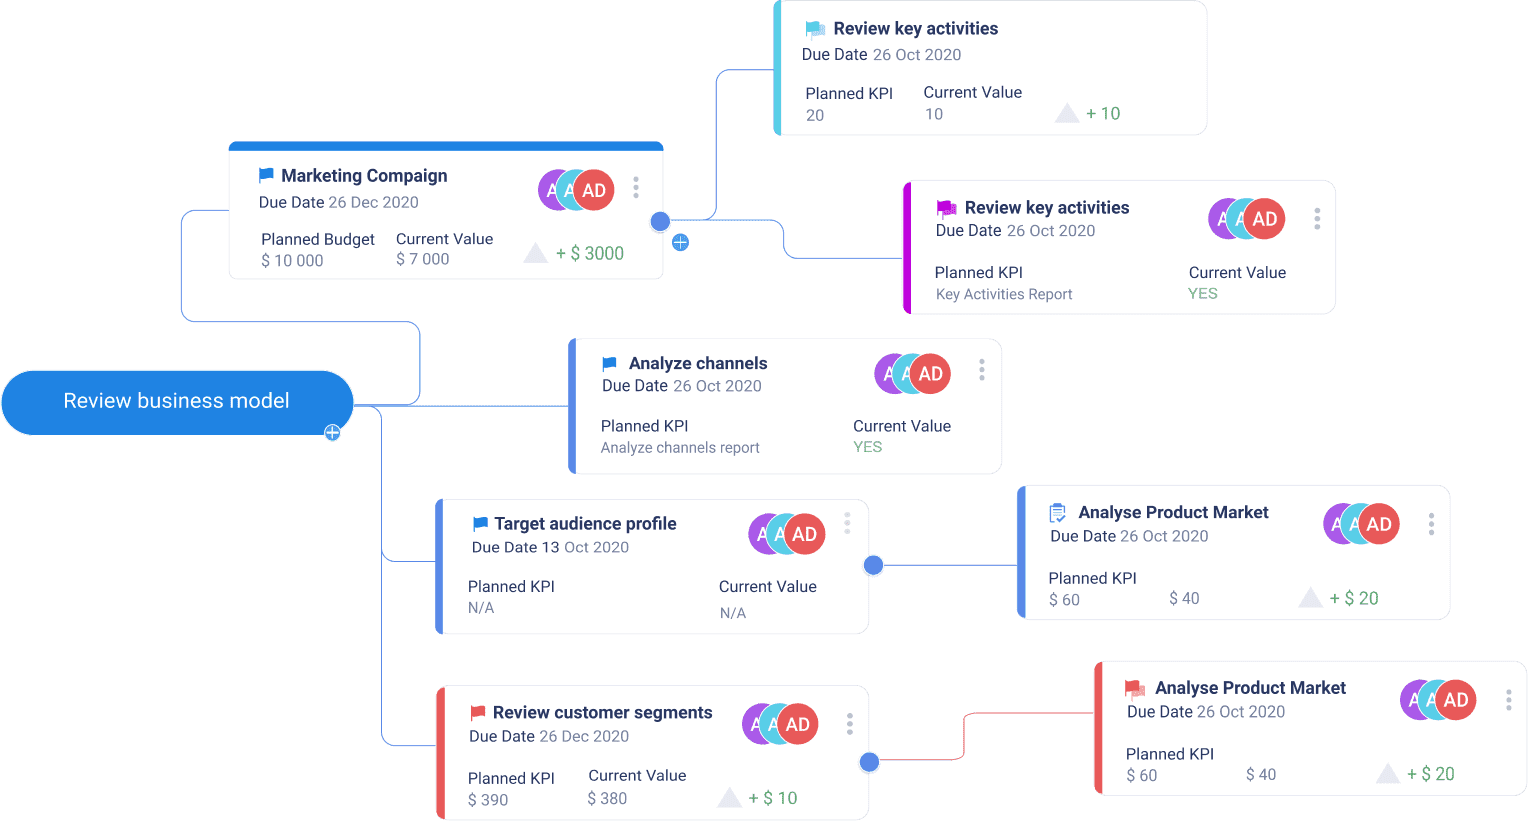
Materials needed: Sticky notes or cards, markers, and large flat surface (wall, whiteboard, table, or floor).
Step 1. Clearly state the topic or the problem you are going to discuss.
Step 2. Distribute markers and sticky notes and ask the team to record each idea on a separate note. Spread the notes on a large surface randomly, but make them visible to everyone.
Step 3. Ask the team to look for ideas that are somehow related and simultaneously ask them to sort the ideas (without saying a word!) into five to ten groupings.
There might be misfits, and there might as well be ideas that fall into two groups. For the latter, make a second note.
Step 4. Start a discussion with the whole team to define categories and create summary or header cards for each such category. When the team is satisfied with the categories, choose a heading for each one. For this, select or write a note that conveys the meaning of the whole group and place it on top.
Step 5. If necessary, combine groups into supergroups and write a new heading. This can happen, when there are duplicate ideas, or when you find significant relationships between groups.
Tips and best practices
- Identify the purpose of this exercise.
- Don’t discuss ideas until the final affinity diagram is complete.
- Develop a logical set of interrelated categories.
- Once the diagram seems to be ready, step back and have another look. Analyze it with other team members to see things from a different angle.
- Remember that the best results are achieved with cross-functional teams.
The affinity diagram technique lets us move away from our habitual thinking and preconceived categories and allow our intuition to discover hidden relationships and associations between concepts. It is believed that the freed-up group intuition can access deeper knowledge and understanding, which is used by project managers, marketing professionals and many others to distil brainstorming outcomes into logical and workable categories.