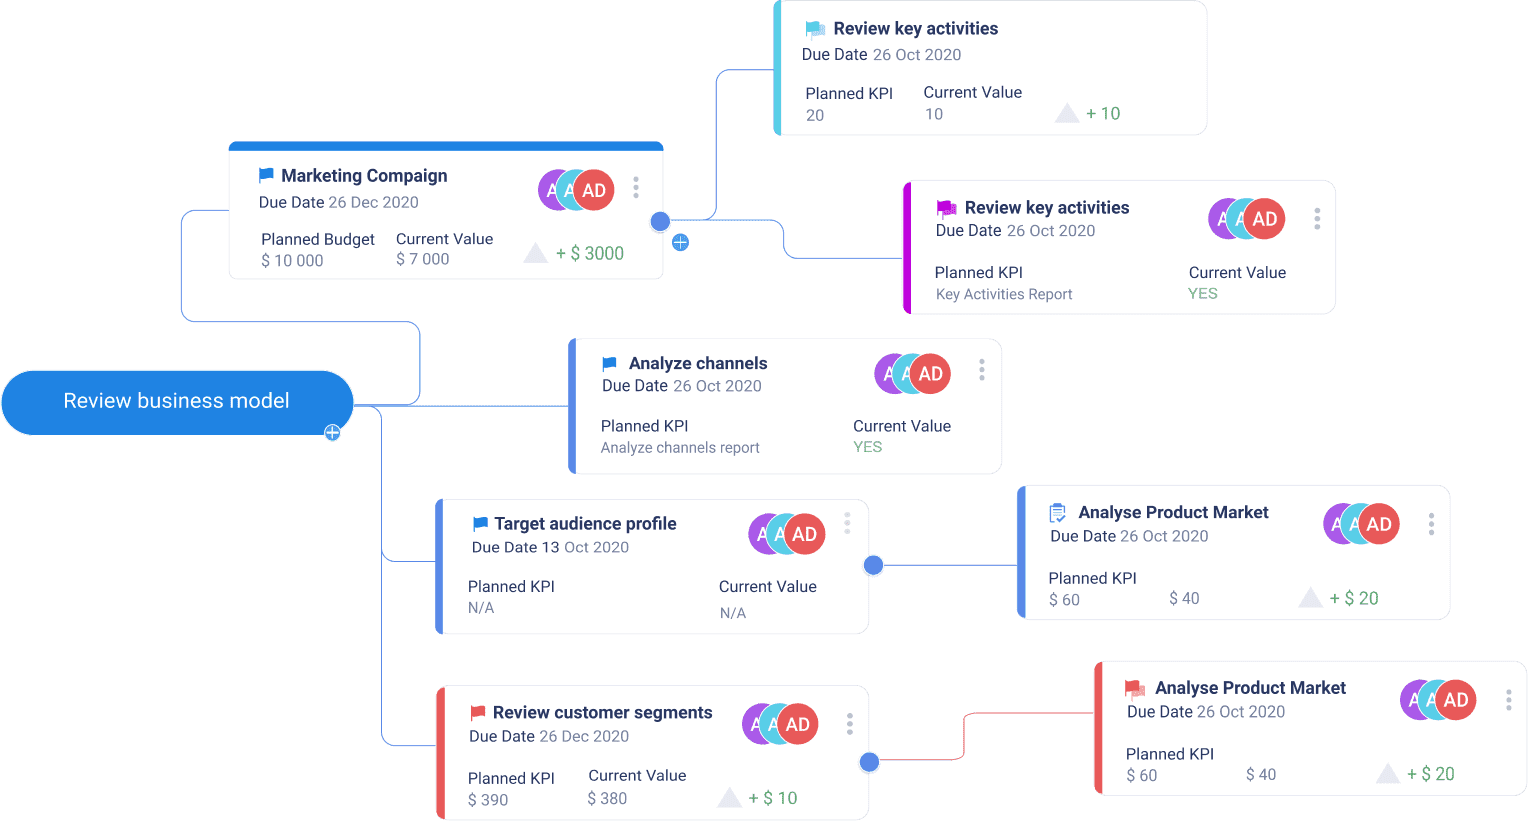
What is Burndown Chart?
The burndown chart is the major Scrum tool to track the Sprint progress and a great visual way to check on the team’s velocity or get an estimate of the actual/probable completion date as compared to the expected one. It is easy to explain and easy to comprehend, and at the same time it gives a meaningful insight into the team’s behavior and time management skills.

A burndown chart is a simple two-dimensional chart that shows the remaining work on a Scrum project, usually within a sprint:
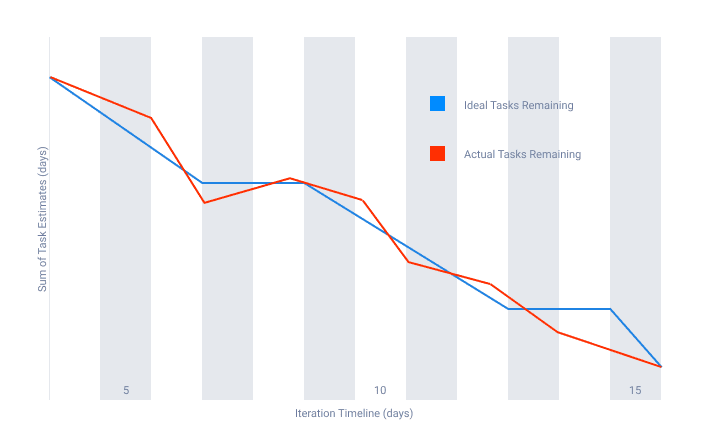
- X axis shows the days in the sprint or in any other iteration
- Y axis plots the remaining work in story points or in other meaningful units, sometimes just in tasks
- Ideal line visualizes the expected progress
- Real line shows the real progress
What can a burndown chart say about the team?
One of the main tasks of a burndown chart is to keep track of the team’s performance to understand what is done efficiently and what needs to be adjusted. Based on the shape of the chart, we can speak of several types of teams.
Ideal team
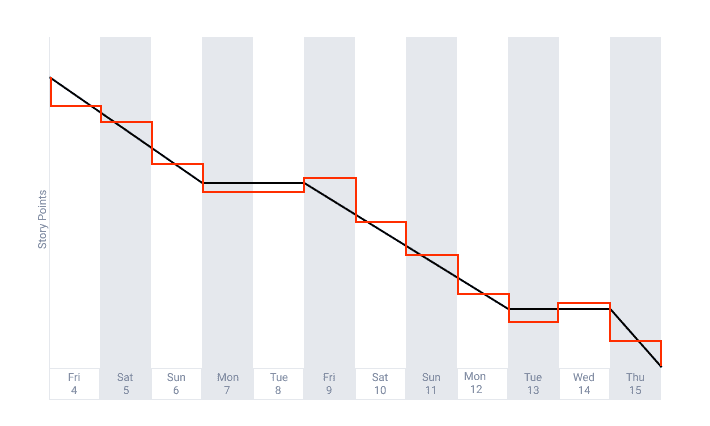
Ideally, you see that the work is getting down uniformly as the sprint progresses. In this case, the ideal and the real lines almost coincide. This is an indication that the team is doing a great job without over-committing or under-committing. The team members are extremely disciplined to update the progress regularly.
Great team
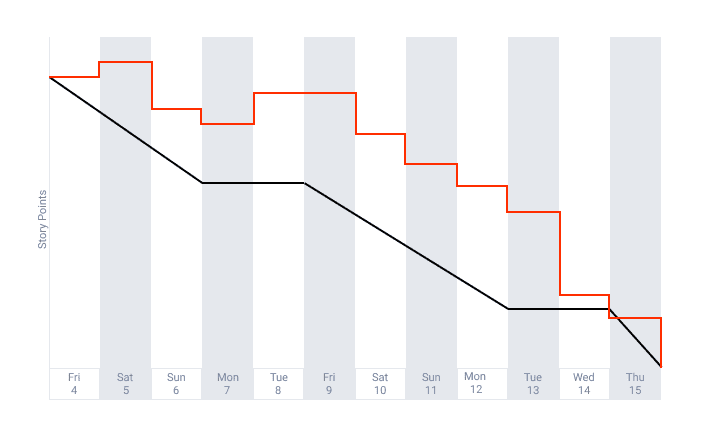
A more real-life scenario would be to have an experienced and agile team that can adapt the scope when needed and speed up closer to the end of the sprint to make sure that the work is done. This chart shape is an indicator that the team is reflecting on their progress and is committed to achieving the sprint goal.
Unconfident team
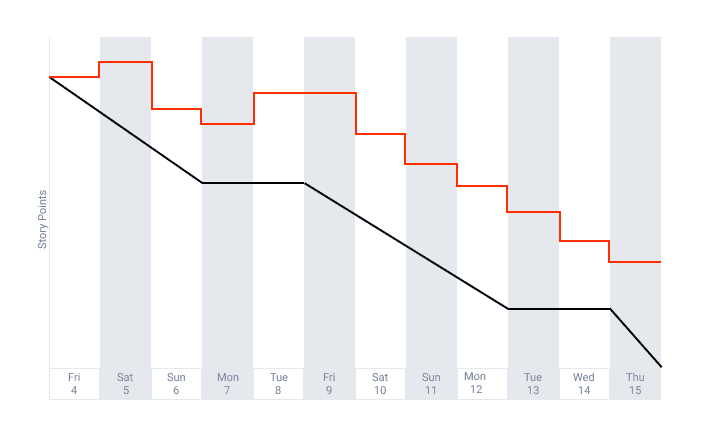
Another typical way of working with good teams is delivering the most valuable items on time and completing the rest of the work in the first days of the following sprint. Such teams are still committed to the goal and can still speed up by the end of the sprint; they are still reflective and disciplined. In many cases, a small gap between the expected and the actual delivery date is not a problem. However, it may be a signal to the Product Owner to adjust priorities, modify the sprint backlog scope, or to simplify requirements.
Undercommitting team
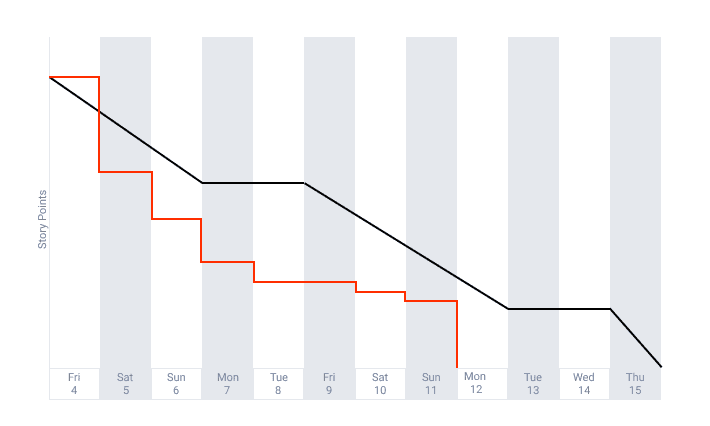
If there is not much to be done by the end of the sprint, it indicates that there have not been enough backlog items, or the story points have been overestimated. This results in the team having nothing to do during the last days of the sprint. A good solution would be to add new tasks to the sprint as soon as it becomes evident that the workload has been miscalculated.
Problematic team
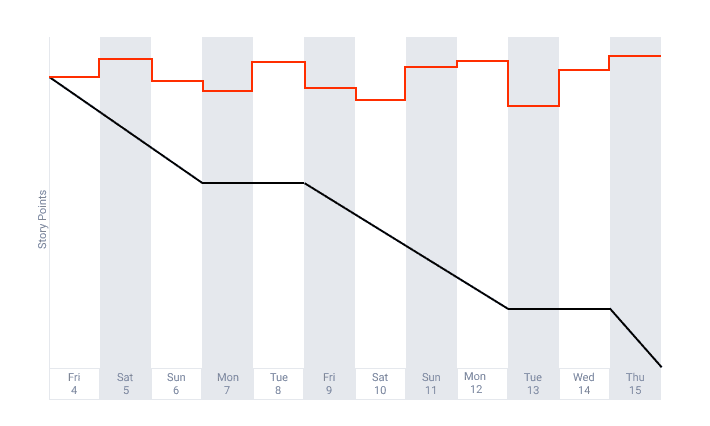
In some cases, the chart looks chaotic and shows no clear pattern of work. This might be a signal that the team does not update their work progress regularly, and the Product Owner and the Scrum Master do not pay attention. It might also show that new tasks are added as existing tasks are done, or the user stories are overestimated and the team cannot complete them on time. In any case, the Product Owner and the Product Manager need to have a closer look.
The burndown chart does not aim at putting the blame on the developers or microcontrolling the team; it rather helps the development team and the products adjust their goals and make sure that the team gets just enough work to deliver on time as much as possible and not to be constantly overloaded.

